
Dear subscriber
Welcome to a special bonus edition of the Bitcoin ESG Forecast #013.
One of the criticisms levelled at Bitcoin has been “we have no way of knowing what will happen to emissions as price spikes, and hashrate grows”.
We just laid that criticism to rest.
This new chart, the result of 12 months research from the Digital Assets Research Institute (DARI) says: “Bitcoin price and hashrate can quadruple, but emissions don’t grow”.

We’ve never been able to convincingly make that claim until now.
Today we are announcing 4 more live charts, that are both useful and gorgeous! Together these 5 live charts give us the most complete picture of Bitcoin’s sustainability trend that we’ve ever had. But first, story time.
Last year, Willy Woo and I caught up while we were both in New Zealand, with the vision of creating live charts, with open sourced data and a transparent methodology so everyone could see how we calculate it and what the results are in real time?”
Since then, this has become a formal collaboration between the DARI and Woonomic. Now, for the first time we have realtime open-source charting of the most important ESG tracking for Bitcoin.
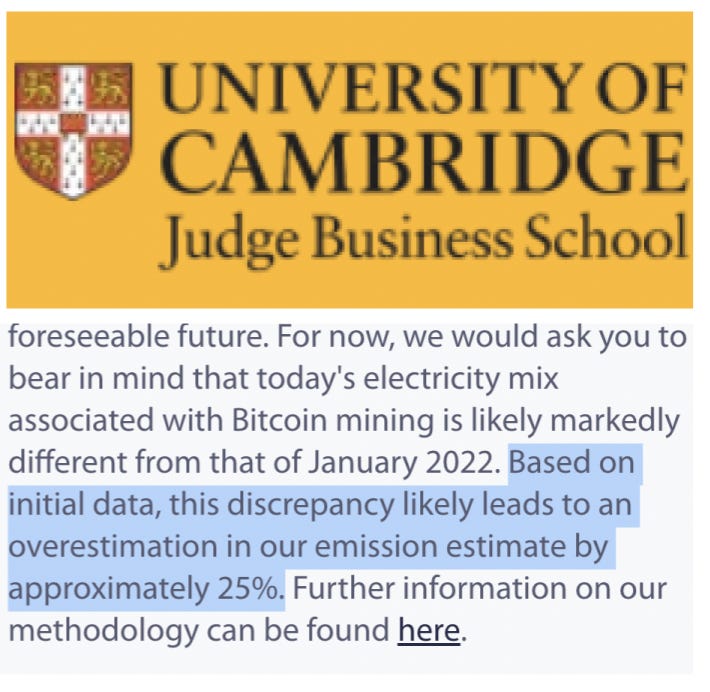
These are the live version of the static charts that Bloomberg Intelligence started using in September last year, after realising that Cambridge’s charts had lost their tune and were over-reporting emissions and underreporting sustainable energy mix, something which Cambridge themselves have now publicly acknowledged on their website (another win, that almost no one knows about)
OK, so here’s the full story.
New full time high
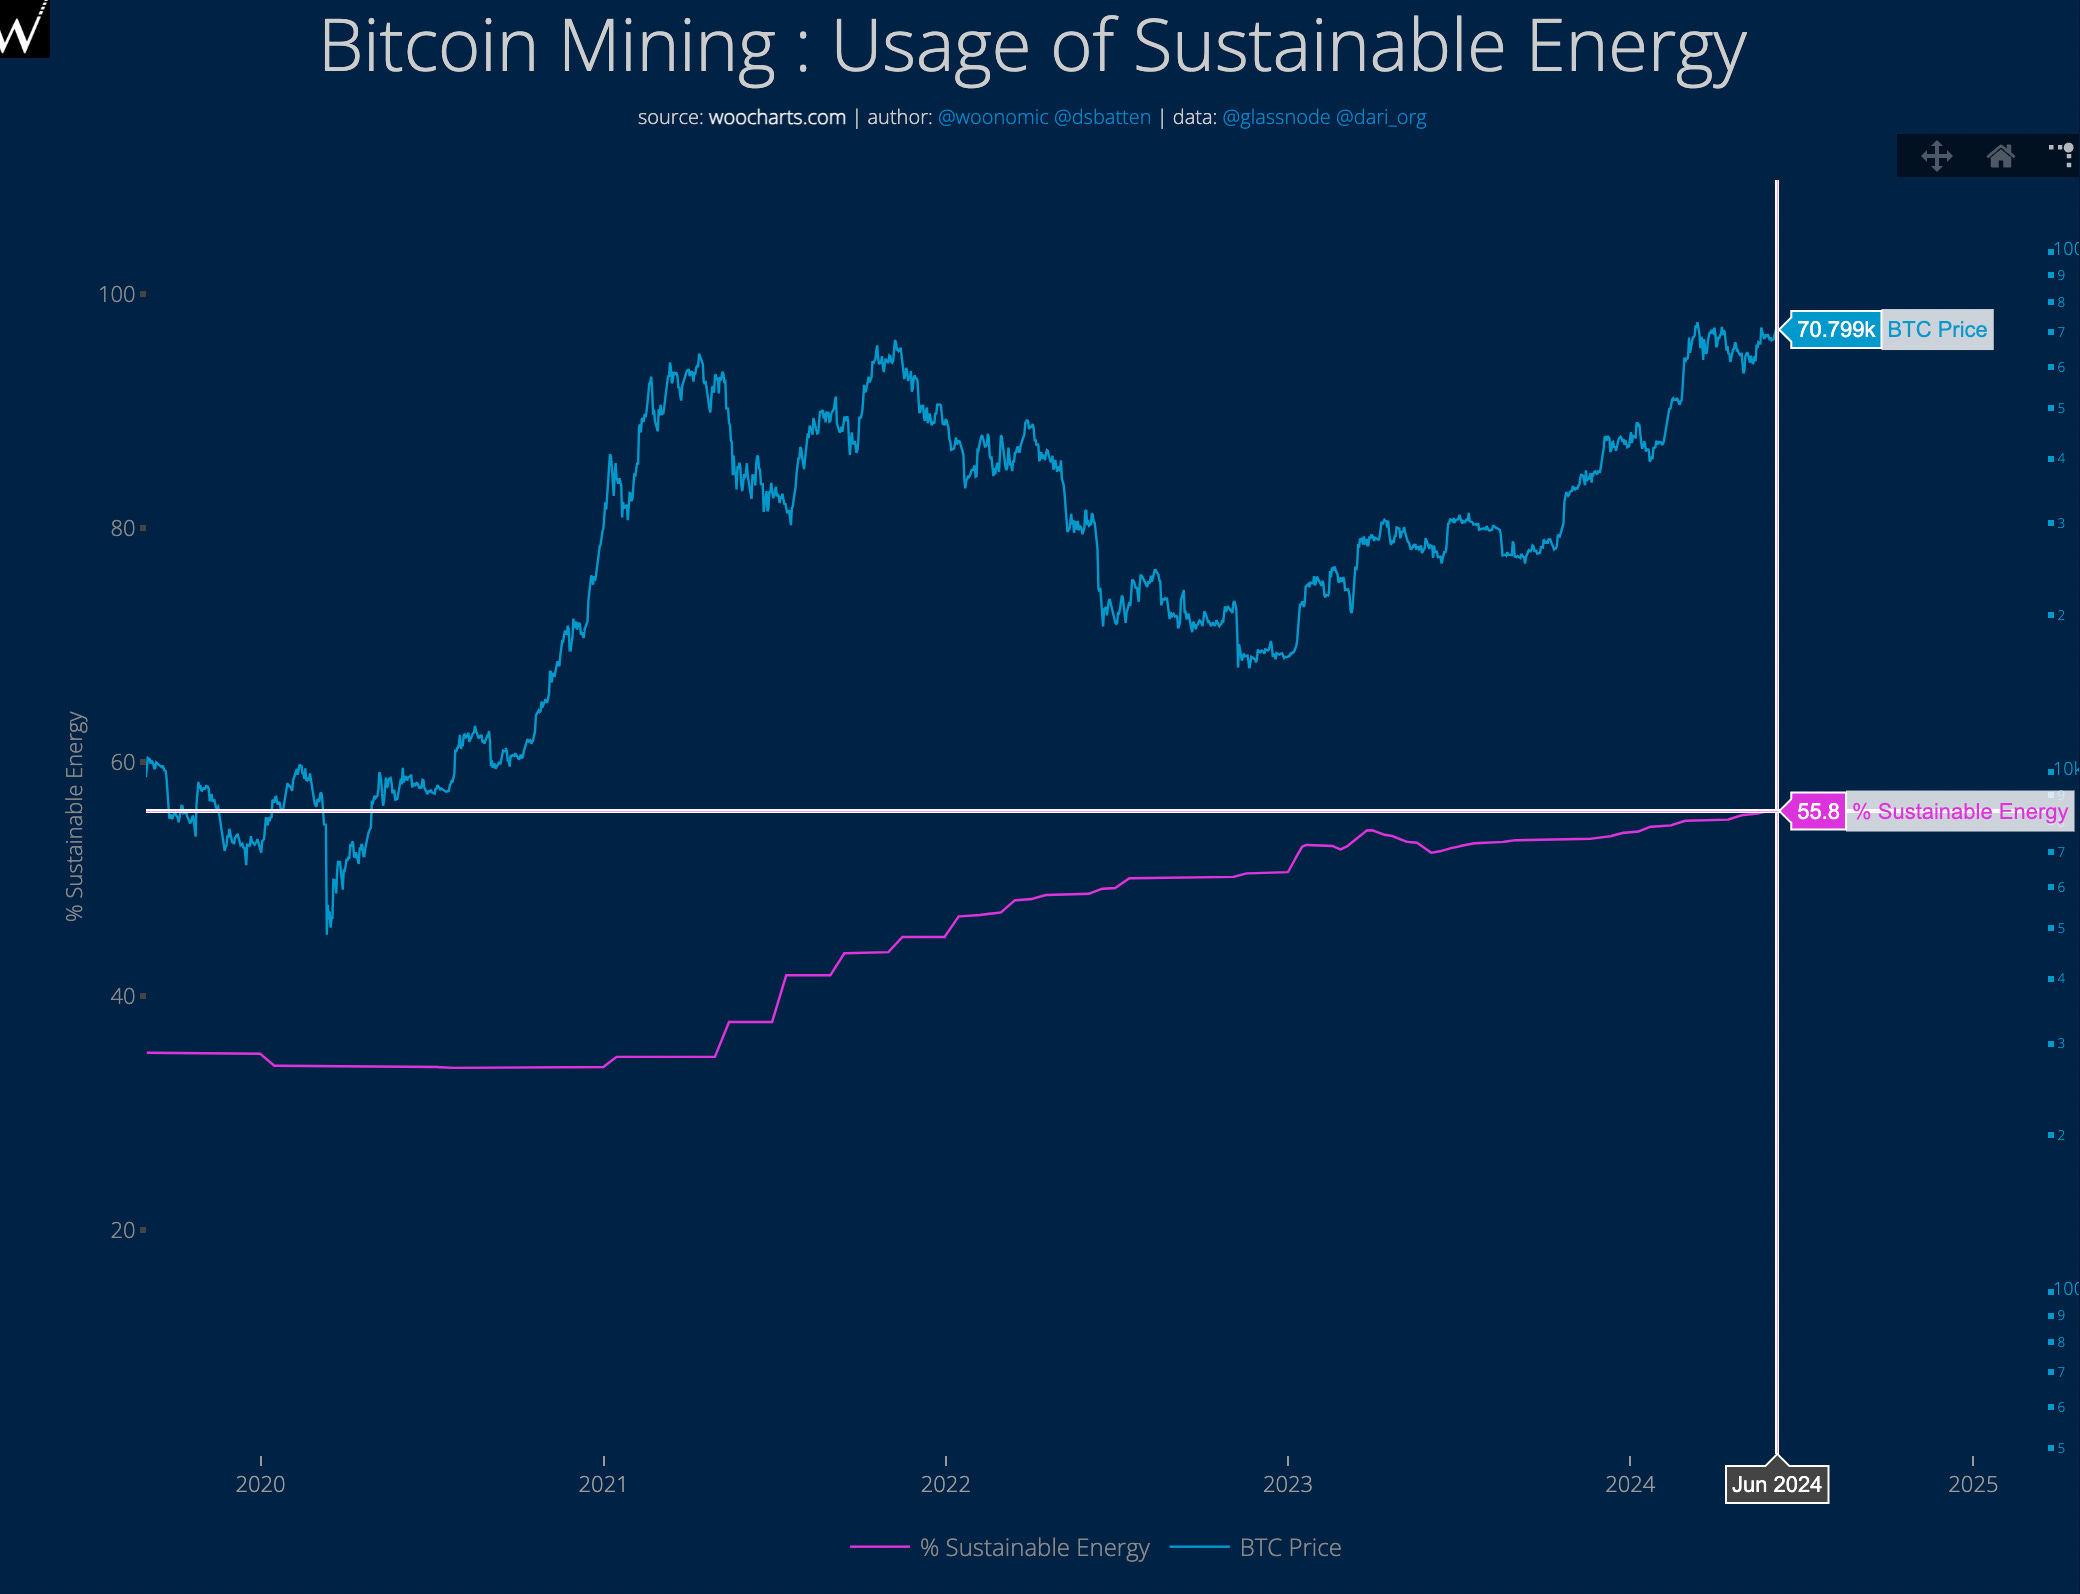
Bitcoin is now at 55.8% sustainable energy use. This is the highest it’s ever been. It’s already higher than any other industry, and is pulling away further as other industries struggle to transition their fuel source.
New all time low
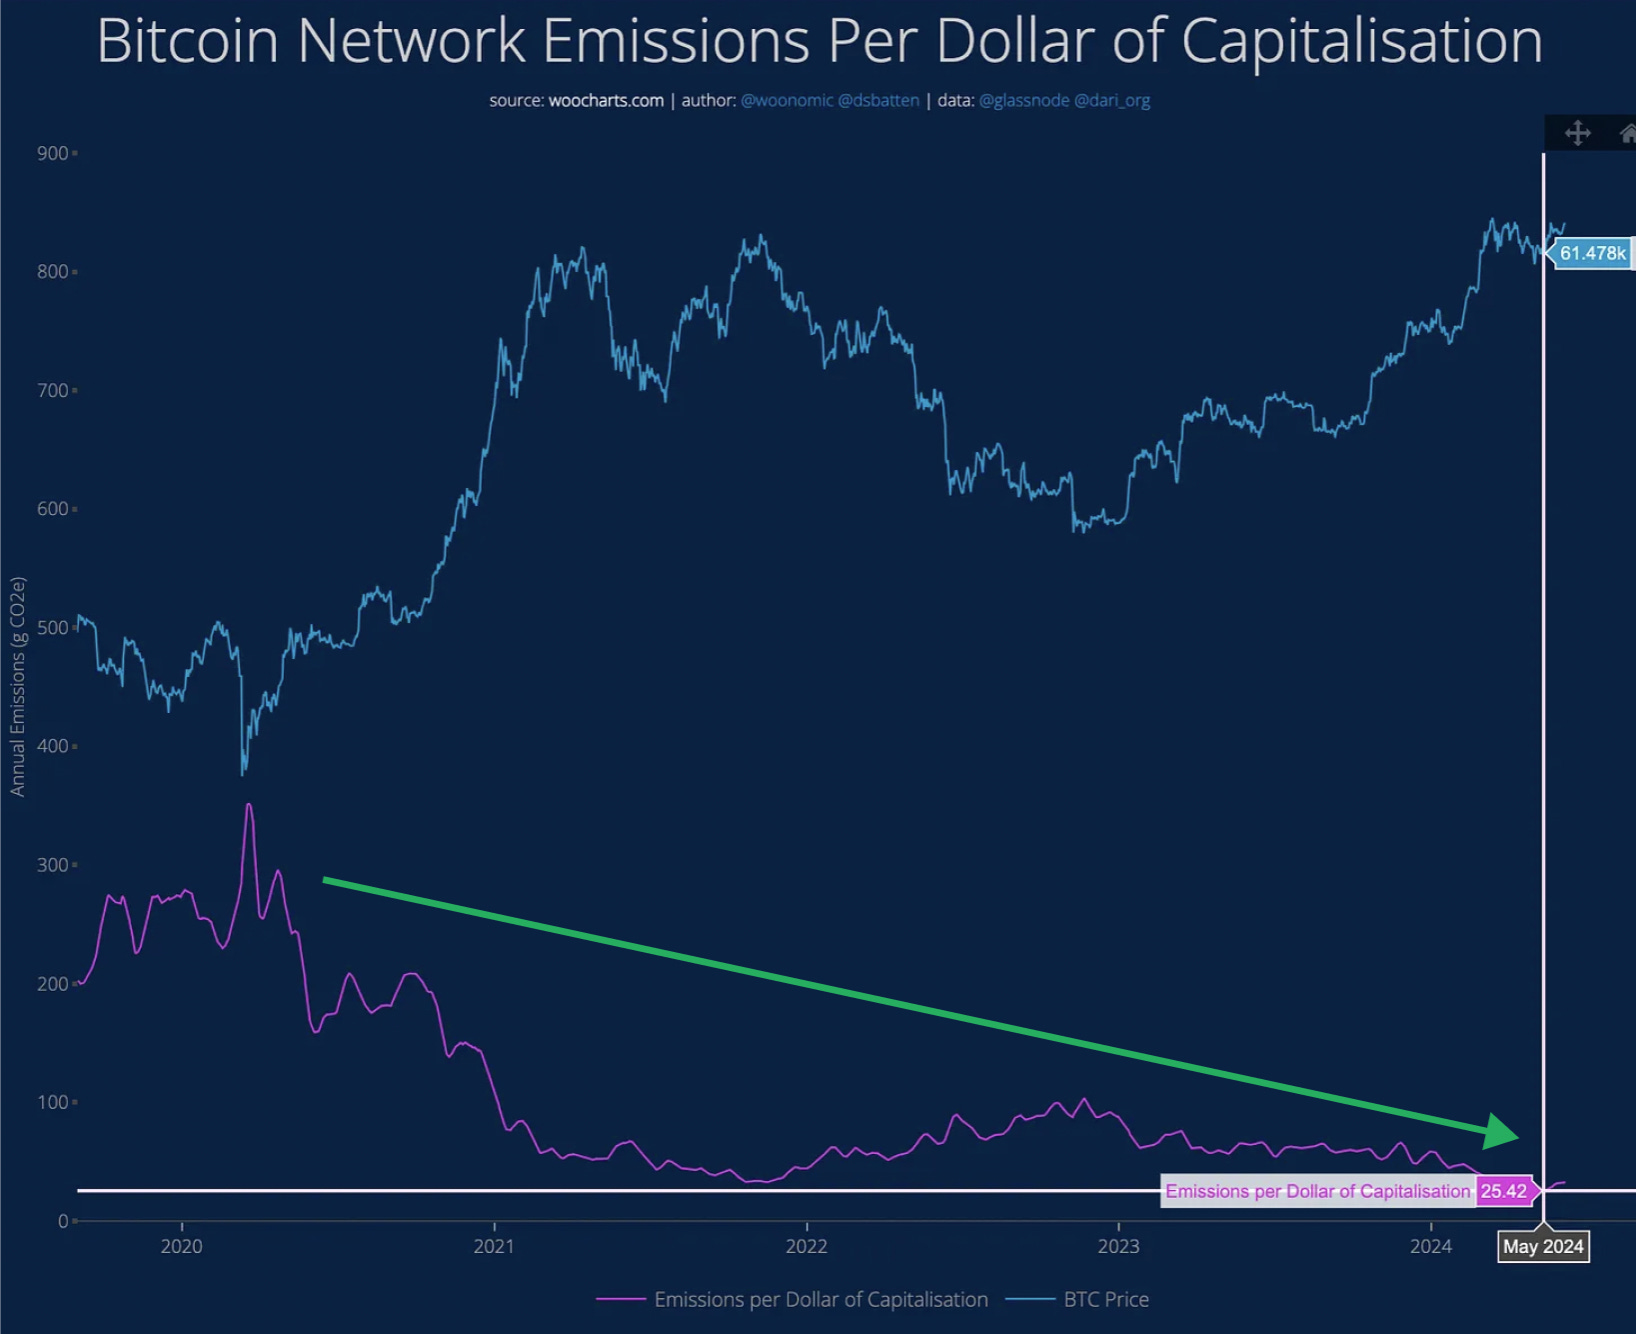
Last month, the Bitcoin network achieved its lowest level of emissions per dollar of Bitcoin’s market cap. This is important, because in the fiat economy, there is a widely documented correlation between GDP growth and emission growth, as we can see in this Our World in Data chart below

By contrast, The Bitcoin Network Emissions Per Dollar or Capitalisation chart below shows that the world may have a global monetary system waiting in the wings that does not require emission growth to be a necessary side-effect of economic growth.
Slight Rise in Emission Intensity
Not all ESG indicators for Bitcoin have been in a positive direction this quarter. Emission intensity ticked up, albeit slightly, for the first time in since Feb 2023. The reason for the uptick despite sustainable energy use decreasing was the reveal that Alliance Coal had started mining Bitcoin.
While it’s a small amount of mining, the emission intensity of coal is double that of gas. This means that even a small amount of coal-based mining can have a material impact on emission intensity.
This brings the tally of companies using coal, or coal-waste, to mine Bitcoin to 2 (The other being Stronghold). By contrast, the number of Bitcoin mining companies using 98%+ renewable energy stands at 70.

Methane Mitigation All Time High
On 7 May, Genesis Digital Assets (GDA) it had started methane mitigation based mining in Argentina. Methane mitigation here means that Bitcoin miners are using methane that would otherwise have gone directly into the atmosphere and contributing to climate change, and instead sending it to a generator to create electricity to mine Bitcoin.
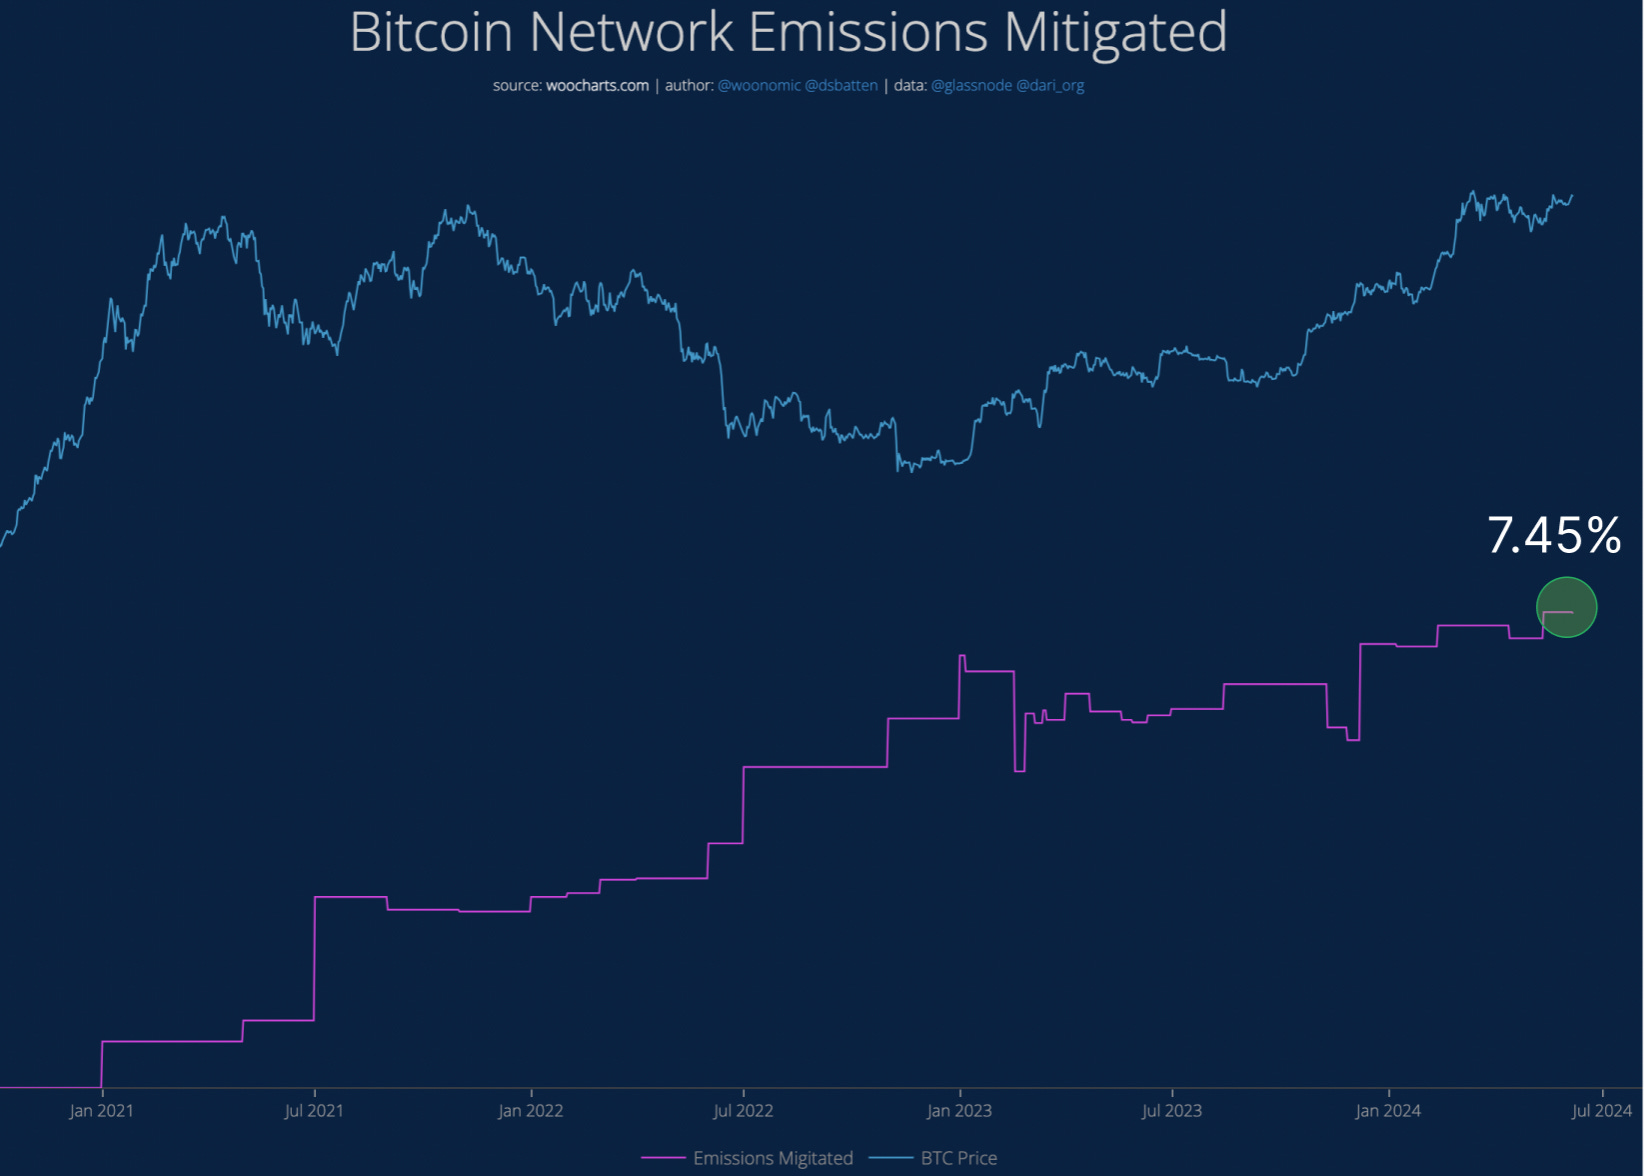
GDA joins 28 other Bitcoin mining companies already reducing methane emissions using this form of mining. Their combined impact is that they mitigate 7.45% of all Bitcoin network emissions.
So where are the live charts?
You can find all 5 Bitcoin ESG charts here.
Or for individual links, here are the live charts for

A final note, Bitcoin like eVs has no direct emissions. Like eVs, it is a fully electrified technology. And also like eVs Bitcoin mining has secondary emissions from using electricity that may come in whole or in part from a fossil fuel source.
However, in Bitcoin mining’s case, it uses more sustainably sourced electricity than eVs because of miners’ unique ability to form direct relationships with power-suppliers, which are usually renewable since that’s what’s cheapest in ~80% of cases.
See you in the next issue
PS: Most people still think China banned Bitcoin mining, Cambridge has up-to-date data on Bitcoin, and Bitcoin is mainly fossil fuel based. They have no idea it has 70 renewable operators, and is accelerating renewable and microgrid expansion in China, Texas and Kenya. So please pirate the content in this newsletter and share the data in it with as many people as possible. Just maybe encourage the occasional person to subscribe too, so I can maintain this depth of research. Thanks!
The live charts are on BEEST, my tracker of Bitcoin's energy use and emissions.
Interested in coaching? Read about coaching for Bitcoiners.